GOLD, H4 triangle ‘works’ like a Swiss clock
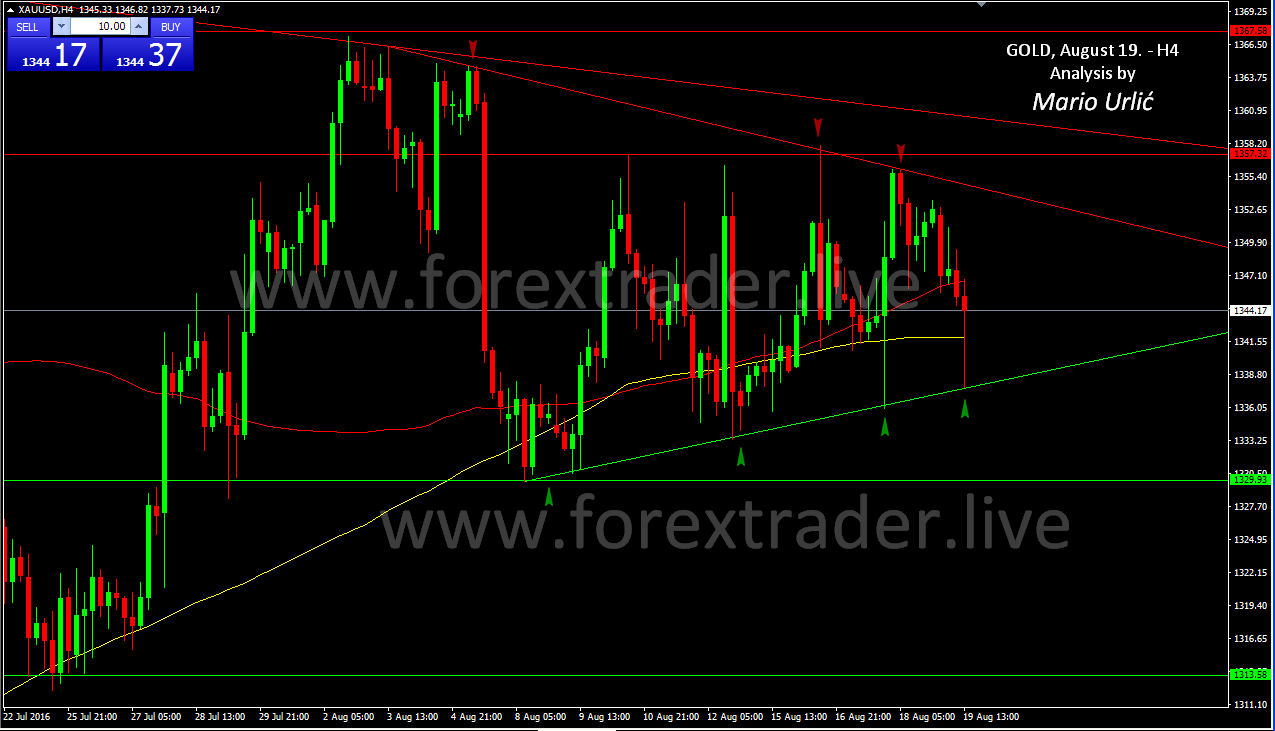
Gold traders are relentless in August with sharp and quick turnovers, but when you see my analysis on H4 chart, you can see how they are moving the price precisely in between the simetrical triangle and SR levels. On the down side, up trend line is the place for the buyers and on the uper side, strong resistance at 1357 and down trend line is the place for sellers. Battle in wich there is no winner for now, with medium price at the aprox 1345/47, but the triangle could be broken up or down after 4 attempts from both sides until today. In that case, watch the SR levels pointed here. Well, I must say that the gold is holding very well in general on high levels after Brexit, because the stock markets didn’t stop with gains from that date. How do you see the precious metal from now on?

Too many strange moves on gold lately?
LikeLike
hey “SNIPER” this is the first time I am not losing in market all because of you. Thank’s a ton. After looking your charts for many times and reading your analysis I also started drawing trendline’s and placed 100-200 sma on chart. this was the first time I controlled myself and din’t traded gold market between this triangle.
Thanks A Ton ………
LikeLike
It’s realy nice to see something like this. You’re welcome, keep pushing forward and stay focus 99,9% while you trade.
LikeLike