How acurate technical analysis could be!?
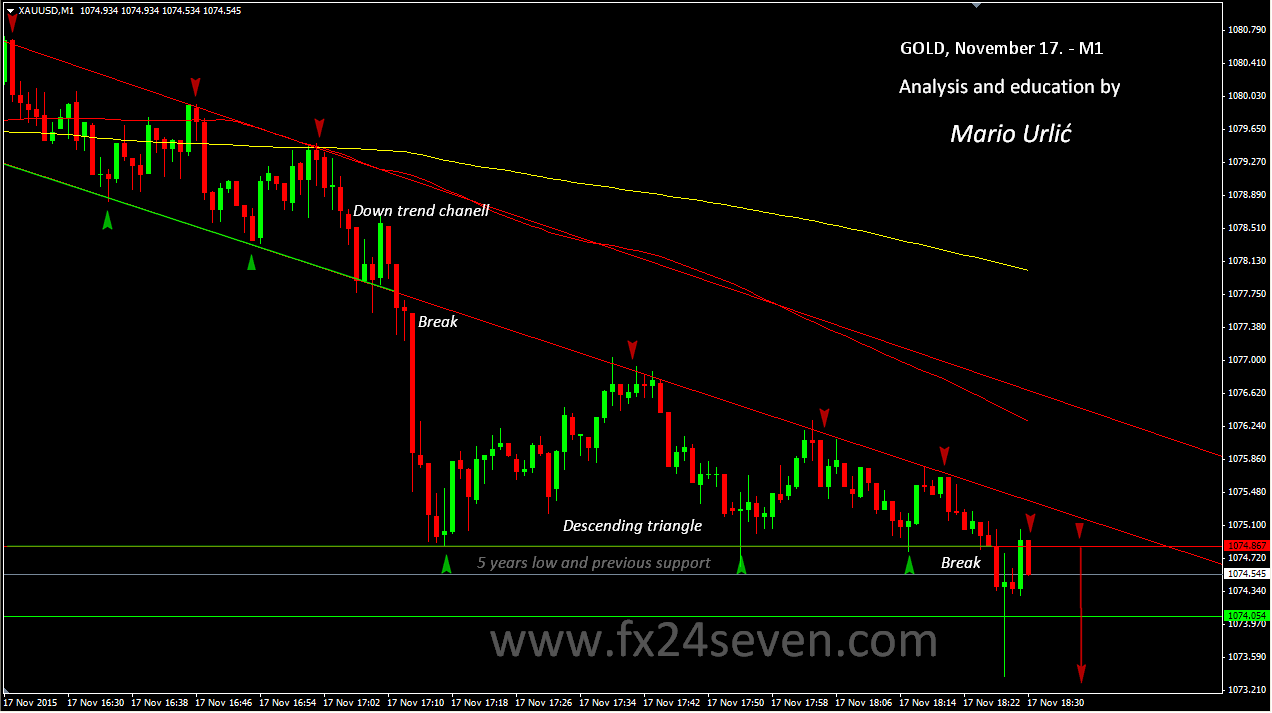
You can see exactly here in this GOLD 1 minute chart with SR levels and trend lines. This is just happening in the market, the gold sellers are strong and they are trying to reach new low for Gold in the last 5 years. I pointed in my previous gold analysis in this possibility and here we are, cent by cent lower until the next possible support level, in my point of view, 1060 > 1055 > 1044. Perfect price leading from the technical traders! At first, downtrend true the equdistant channel > break, move true the descending triangle > break and possible furder fall… Beautiful.
