Gold hit a strong weekly down trendline!
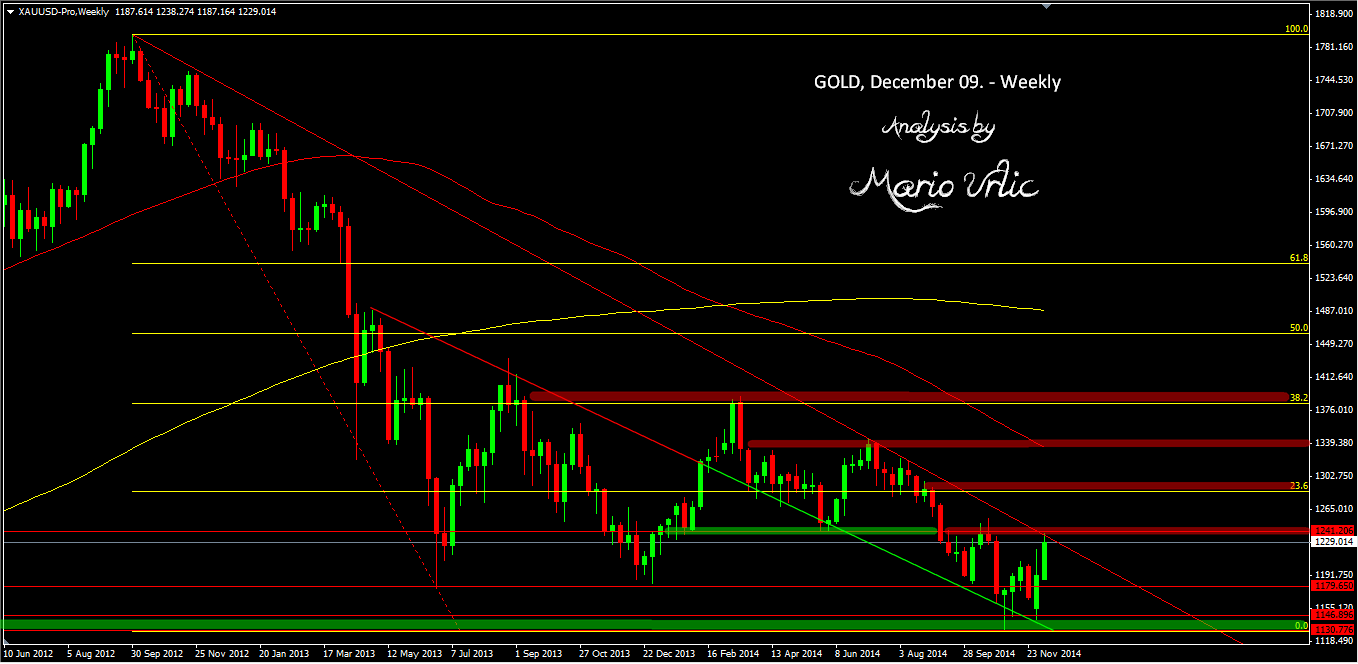
Let’s take a look what do have on weekly chart at gold? After the Swiss gold referendum results, the gold opened last week with decline to the strong support at 1246/48 and rocketed on the same day up, all the way to the 1221 high. The rest of the week gold moves from 1215 and 1286, trying to consolidate and close the week at 1191. Gold opened this week at 1187 and start to rise from the same level, catching 1238 high today. As we can see at this chart, that level between 1240/50 is previous support/resistance level and what more important is, there is a very strong weekly down trendline now. What do we have more here? Daily MA100 at 1237, then 50% fibo return from the July 10. –> November 07. fall at 1238… Do we need something more? I think that’s enough for serious test. Well, the bulls have a lot to do now if they want to push gold higher to the next resistances. 1240/50 is the first real step on the way to the recovery. What do you think traders?
