GOLD, possible H&S on H4!?
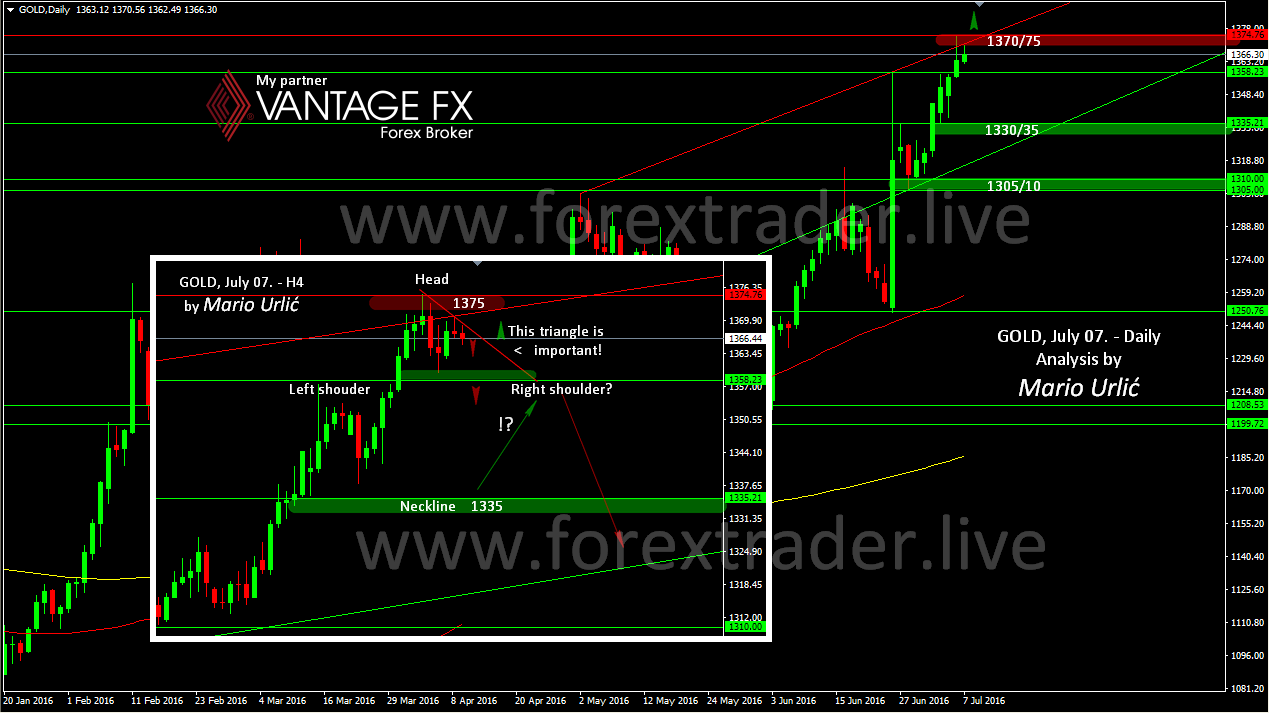
The precious metal is extremely bullish for days, but the buyers can’t brake the resistance trend line at 1370/75 for now. That’s why I see the possibility of the H&S formation at the H4 chart. Of course, this descending triangle is important for furder developments and it could reverse the gold up again if the same will be broken!? It’s not easy to go short on gold in the bullish momentum like this one after Brexit, but for sure it will be interesting to follow the next moves here based on this technical view. Is there any bears to try this? We will see soon. On the way up, triangle trendline is the first line of resistance all the way to 1370 and 1375 is the stronger one. On the way down, the support at 1358/61 is waiting ‘to ruin’ the possibility of this H&S formation, 1350 is the next one, 1330/35 the strong one. For now, gold looks preaty neutral on the H4 chart today, but let’s see the solution. What’s you’re view on this traders?
