US Unemployment Rate 2009 – 2019
Total nonfarm payroll employment increased by 304,000 in January, and the unemployment rate edged up to 4.0 percent from the previous 3.7 percent from September and November 2018, the U.S. Bureau of Labor Statistics reported yesterday. So, let’s take a quick look at the 10 year US Unemployment chart, from the highest crisis point at 10 percent, which was on October 31. 2009. After that date, the unemployment rate was in constat fall, with short-term increases from time to time. That’s how, the average in this 10 years is 6.8 percent, with the lowest point of 3.7 percent from September 30. and November 30. 2018. Considering that some analysts are already predicting a new crisis based on the unemployment data, many of them for years, based on this slight increase, we can’t predict or conclude nothing in my point of view. All we can do is to follow furder unemployment data and FED’s decisions based on the economic indicators. Here’s how US Unemployment rate looks like from 2009 until today.
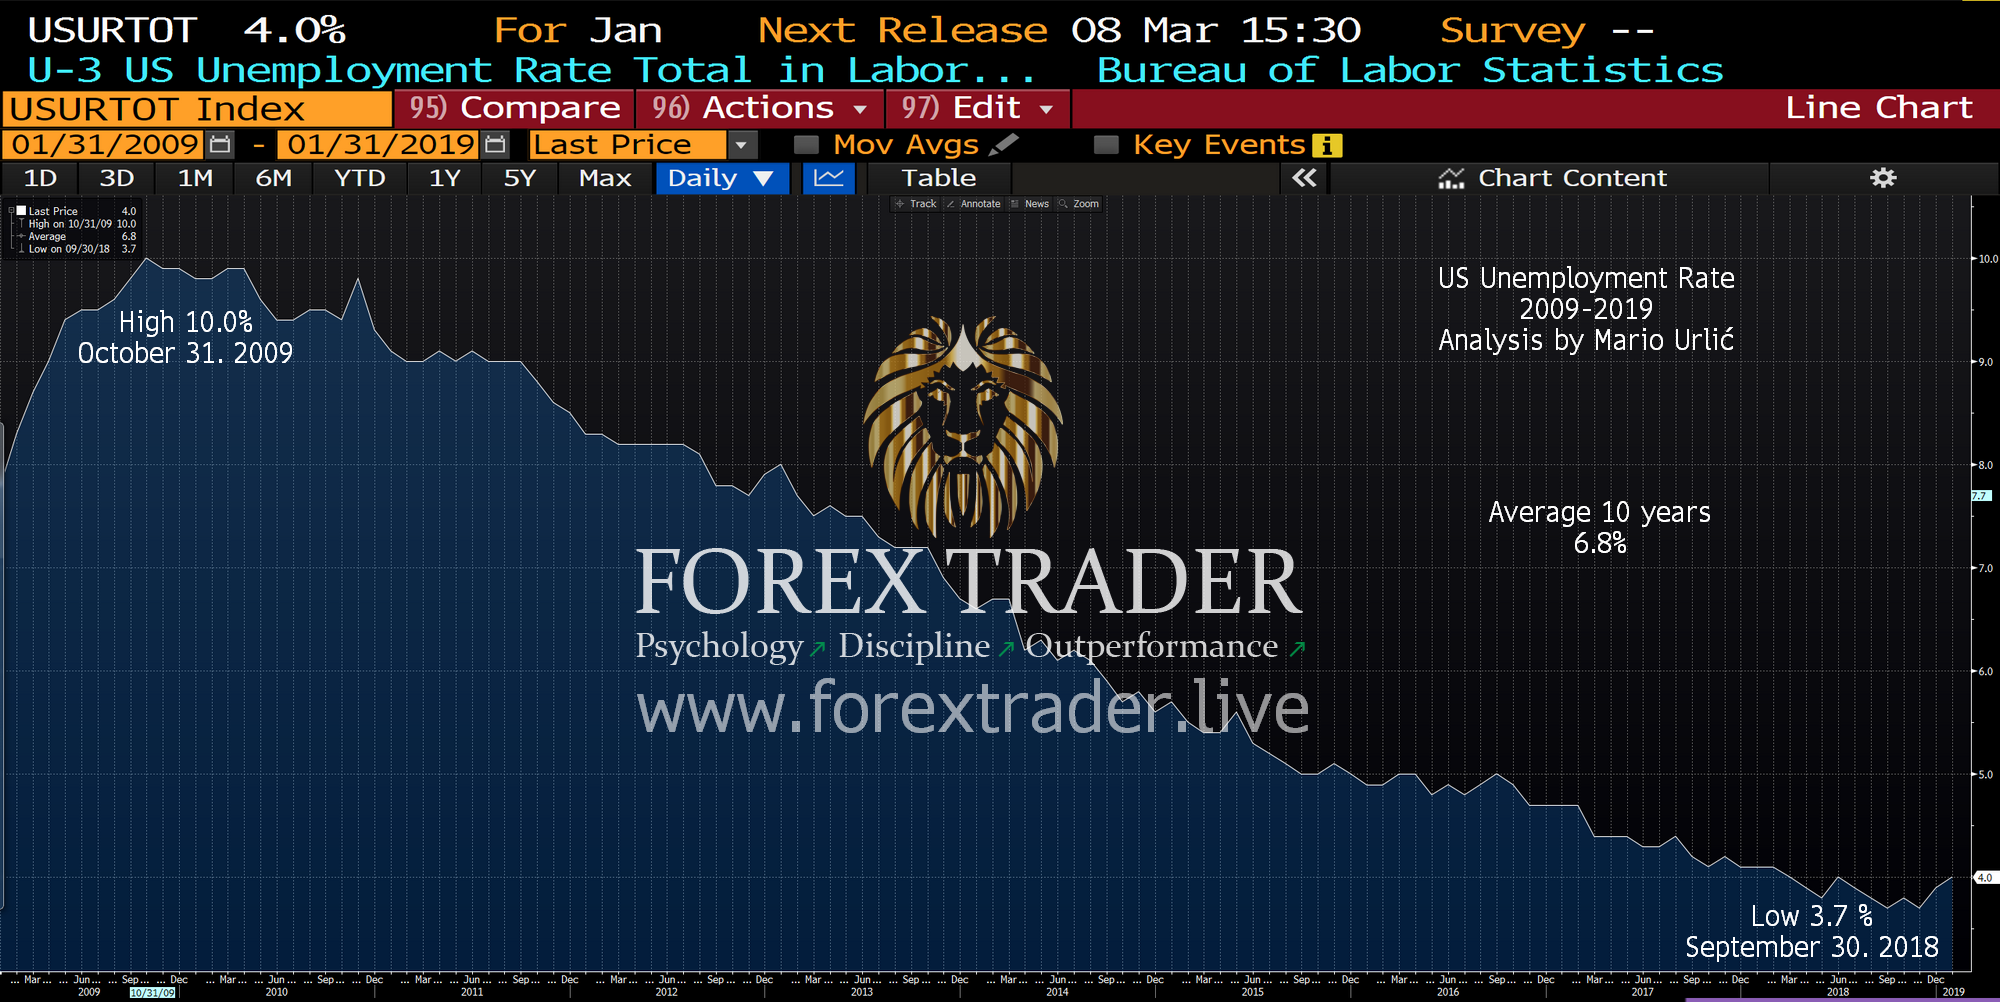
Chart: Bloomberg Terminal
