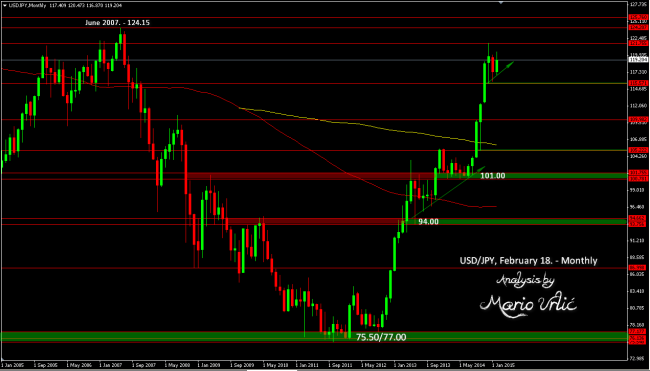
USD/JPY, 124.00 to cover 2007.-2011. complete loss!
Can the US dollar cover complete loss from 2007-2011 fall? We could see that there is enough buyers on every USD/JPY decline, ready to cover every loss here. Based on this monthly graph, first resistance is December 2014. high at 121.80 and if US dollar bulls could brake that level, 124.00 could be sure thing in the following months. But, that would not be an easy job for the ‘USD lovers’! The most important thing in furder developments here will be the FED monetary policy decisions and possible rate hikes. But, until then, USD still remain strongly bullish at this pair.

I am actually grateful to the holder of this site who has shared this impressive paragraph at at this time.
LikeLike
Kuroda also have said that the Jen is to weak now, that could be also a trigger for the way back.
LikeLike
Sorry I have made a typo. In the penultimate line I should have said ‘the fact that the price action is above kumo and tenkan sen is above kijun sen (and not kumo). One of the disadvantages of WordPress is the absence of the ability to edit when typos are spotted.
LikeLike
I can certainly see the arguments in favour of USD/JPY moving to 124.000. However I have reservations that it will happen any time soon (if at all). The current high was made on 8th December 2014 and came in at 121.848. There was then a retracement with a low of 115.561 being made on 16th December 2014. The next high was 120.825 made on 23rd December 2014. There was a retracement with a low of 115.852 being made on 16th January 2015. The next high was 120.484 made on 11th February 2015. As can be seen there have been a series of lower highs which is indicative of a down trend. However there has been an absence of lower lows.For me the most telling indicator is Ichimoku. There are two aspects in favour of a long trend. The first is that the price action is above kumo and the second is that tenkan sen is above kijun sen. However it ends there. Chinkou span is firmly embedded within the price action which tells me there is an absence of a trend. Both tenkan sen and kijun sen are flatlining which gain is indicative of the absence of a trend. However it is probably that a trend will resume sooner or later. The question is whether the price action will take the trend long or short. What is particularly telling is kumo. Past kumo has been quite thick and present kumo has suddenly thinned with future kumo thinning further and remaining thin. The thing about a thin kumo is that the price action can easily pass through. Thus to me it is looking like that the price action is about to go short and develop a short trend. However it should be noted that Ichimoku is a trend following indicator and at present there is clearly no trend. Thus at this stage I would be very reluctant to enter any USD/JPY position. However I do think that a short trend will develop and a good signal to enter a trade (short) is the crossover of tenkan sen and kijun sen. For that to happen the price action is likely to be below kumo which could be used to confirm the call. Thus in summary it really is nothing to do except watch out for the short signal. I think one might be forgiven going long a the present levels given the fact that the price action is above kumo and tenkan sen is above kumo. However it is a high risk trade and there are too many warning signs telling me not to do it. Thus it is not for me.
LikeLike